
Toronto real estate market report
A three-month MLS closed-sale snapshot of the micro-markets, home types and price bands carrying Toronto’s transaction flow.
They are two of Toronto’s most watched condo markets, but this report’s highest-volume shortlist shows why buyers and sellers need to look beyond a single neighbourhood. Explore King West condos (or King West condos for sale and rent) and use the Yorkville condo building list to compare live options building by building.

Who is showing up in this market?
The buyer story behind the sales count
The MLS tells us where properties changed hands. Broader 2026 research helps explain some of the demand behind that activity. These are market-level patterns—not labels applied to any individual buyer or neighbourhood.
First-time owners
TRREB’s 2026 outlook, citing Ipsos polling, says 45% of intending GTA homebuyers are first-time purchasers. That supports the depth of activity in the attainable condo price bands identified in this report.
End-users choosing carefully
The condo market is not one uniform buyer pool. Layout utility, carrying costs, transit access and building quality are being weighed harder—especially in smaller-unit stock.
Move-up & lifestyle buyers
The faster freehold pace points to demand for functional space. Semi-detached homes moved in 22 days citywide in this data cut, versus 39 days for the condo class.
Context sources: TRREB 2026 outlook and Bank of Canada analysis of Toronto’s condo market. These sources provide context only; they are not part of the MLS closed-sale calculation above.
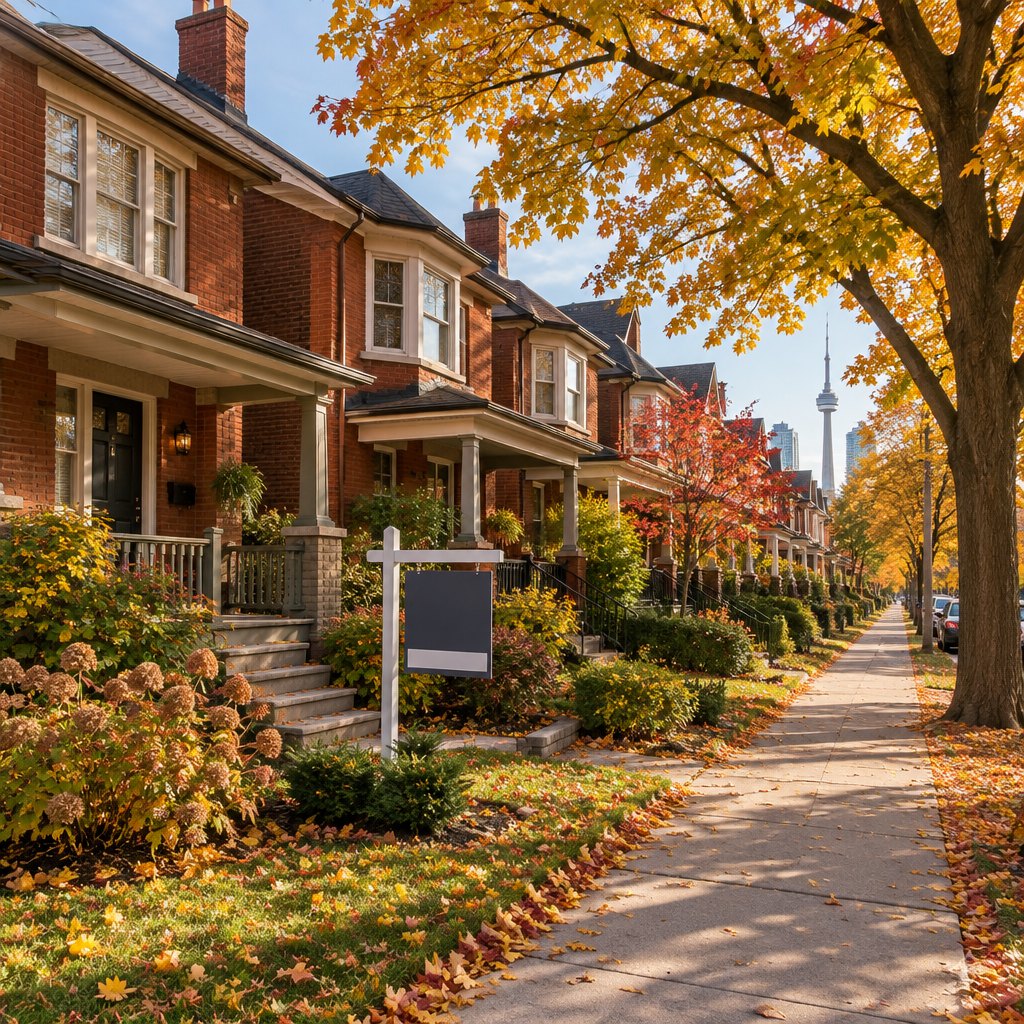
The headline: condos are doing the volume; freehold is moving faster
From August 1 through October 31, 2026, Toronto recorded 5,835 MLS sale closings. Condo-class sales accounted for 3,019 transactions (52%), with an average sold price of $657K, median $561K and average 39 days on market. Residential/freehold sales totalled 2,816 (48%), averaging $1.46M, with a median of $1.16M and 26 days on market. Condo apartments alone recorded 2,603 sales.
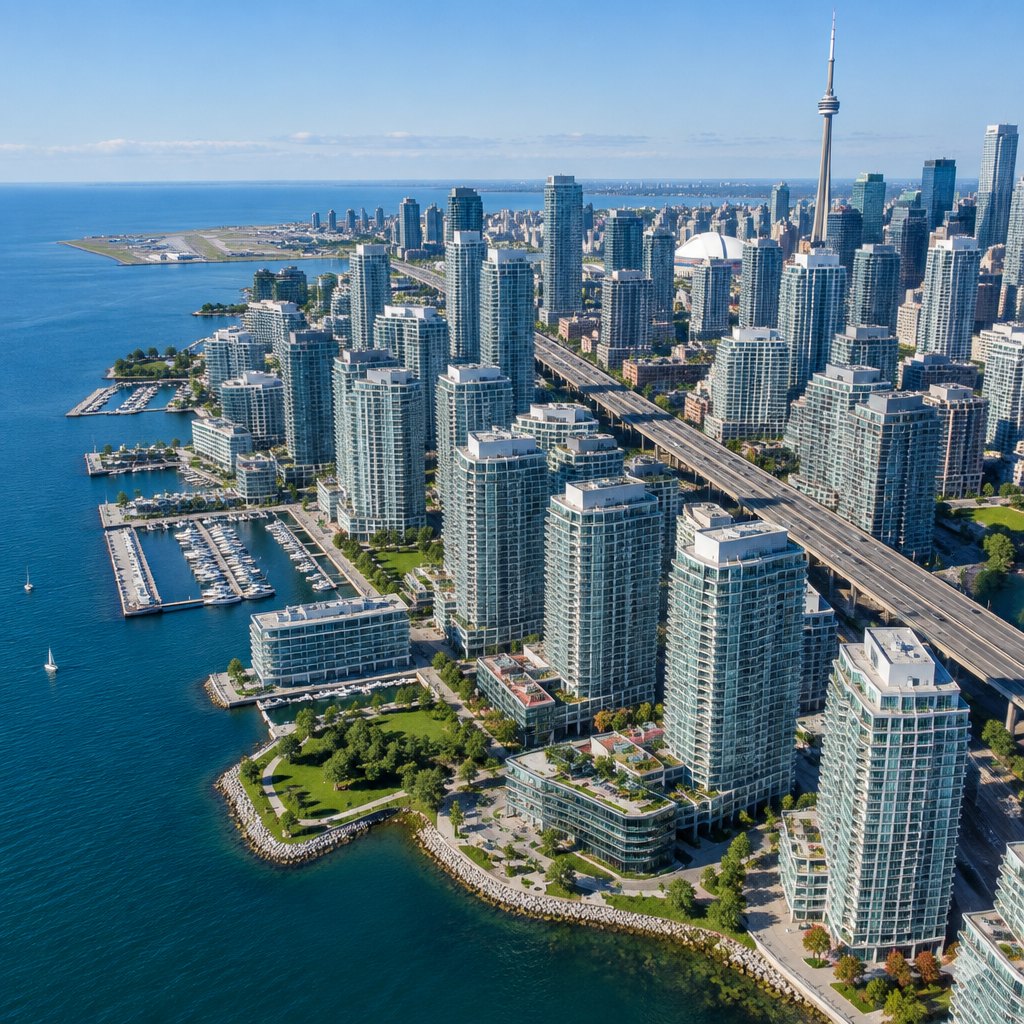
Toronto’s highest-volume identified micro-markets
| Micro-area | Sales | Avg sold | Median | DOM |
|---|---|---|---|---|
| Waterfront Communities C1 Condo apartments |
322 | $699K | $608K | 40 |
| Willowdale East Condos + freehold |
172 | $889K | $613K | 38 |
| Mimico Waterfront condo apartments |
167 | $800K | $655K | 38 |
| Church–Yonge Corridor Downtown condo apartments |
138 | $635K | $567K | 38 |
| Bayview Village Condos + houses |
110 | $870K | $609K | 39 |
| Mount Pleasant West Midtown condo apartments |
100 | $777K | $648K | 31 |
| Bay Street Corridor | 91 | $678K | $533K | 39 |
| Moss Park | 65 | $662K | $535K | 35 |
See the market
The streetscapes behind the numbers
Six current listings in the markets above, with price, size and a direct link to each live listing.


Live listings as of November 2, 2026. Prices and availability change quickly; open a listing for current status.
Want the full Toronto sales-volume brief?
Get the micro-market table and a focused discussion about the neighbourhood or property you are considering.
What is actually moving?
1. The $530K–$700K condo band has the deepest turnover. Church–Yonge, Bay Street, Moss Park and Waterfront C1 recorded median sold prices of roughly $533K–$608K. This is the central, transit-connected ownership pool doing much of the work.
2. Waterfront C1 is the volume leader—but buyers still have choice. Its 322 sales are meaningful, but 40 average days on market makes it a pricing-and-positioning market, not an automatic seller’s market.
3. Midtown has the strongest volume/pace blend. Mount Pleasant West (Yonge & Eglinton) recorded 100 sales at 31 DOM, the quickest pace among the high-volume condo nodes tested.
4. Semi-detached is the faster major freehold category. Citywide detached sales recorded 1,904 closings at an average $1.57M and 27 DOM. Semi-detached sales totalled 636, averaged $1.19M and moved in 22 DOM.
King West and Yorkville: how to use this data
King West sits within the broader downtown condo conversation, where building quality, layout, carrying costs and exact location can create a much larger pricing spread than a neighbourhood-average figure suggests. Start with the King West condo building list, then compare active inventory against the surrounding downtown flow.
Yorkville is a different conversation: it is a premium, lower-volume micro-market where suite condition, building pedigree and scarcity are central. For active building-level comparison, visit the Yorkville condo building list or the Yorkville condo map.
Search live inventory in the markets that matter
Active inventory and availability change quickly. Use the live neighbourhood pages below to open current listings, photographs and property details.
Waterfront Communities C1
Toronto waterfront inventory
Search current sale listings and open each IDX listing for photos, status and details.
Explore your primary areas
King West & Yorkville
Search active condos, compare buildings and request a targeted valuation.
Keep exploring Toronto neighbourhoods
- King West condos: 60 buildings, map and listings
- Yorkville condos: luxury towers and building guides
- Yonge and Eglinton condos and Yonge and Sheppard condos
- Yonge and St. Clair condos and Yonge, Bay and Bloor
- Ontario HST rebate on new homes: save up to $130,000 by March 31, 2027
- Top 25 pre-construction projects for 2027 and the Toronto investor guide
- Selling? Get a free home evaluation
Methodology: Toronto MLS sale closings, August 1–October 31, 2026. The micro-market list is a validated shortlist of high-volume areas tested from live sold data, not a claim of an exhaustive ranking of every Toronto neighbourhood. This information is not financial or investment advice. Not intended to solicit buyers or sellers currently under contract with another brokerage.
About the author

Yossi Kaplan, MBA
Realtor & Sales Representative · Right At Home Realty, Toronto
- Specializing in real estate investments, new homes and pre-construction.
- Excellent negotiator. Licensed since 2005, hundreds of transactions.
- Great with math and finance. I read the data so you buy and sell right.
- Friendly & professional. Straight answers, no pressure.