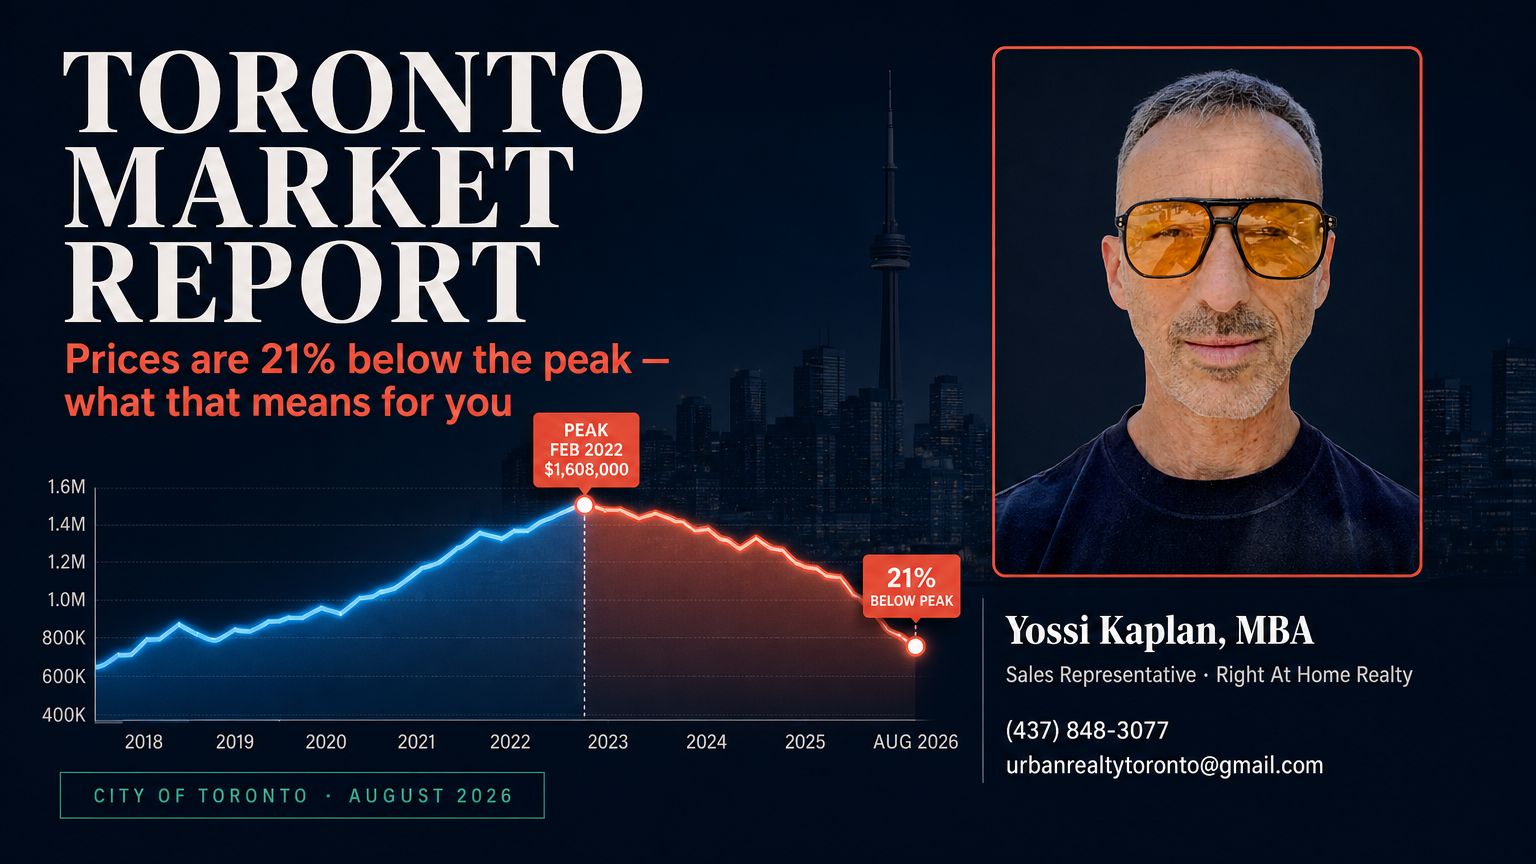
The Toronto Market Report — August 2026
Average prices are 21% below the peak, condos keep sliding while detached holds flat, and new listings just fell 15.7% in a single month. Here’s what it means if you’re selling.
Want the full picture for your home?
Tell me what you’re thinking about — I’ll send a personalized market update within 24 hours.
I’m looking toBuy / InvestSellLease / Rent
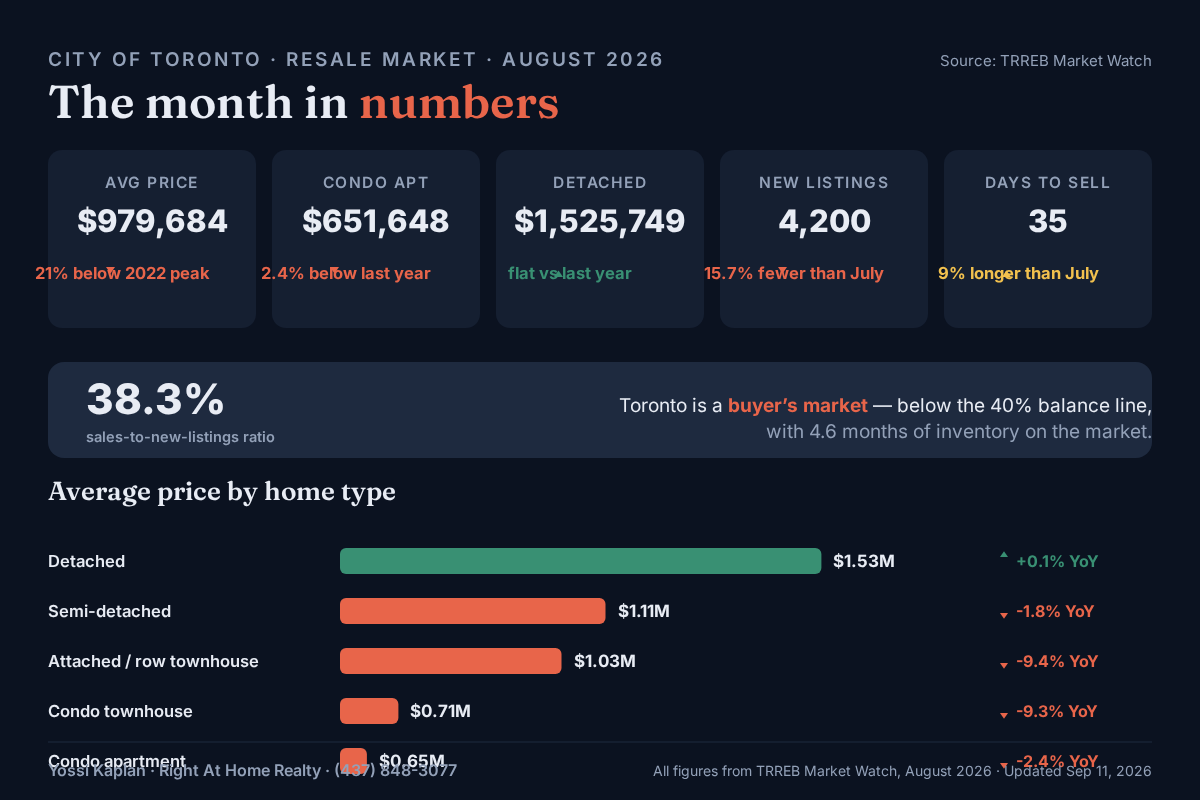
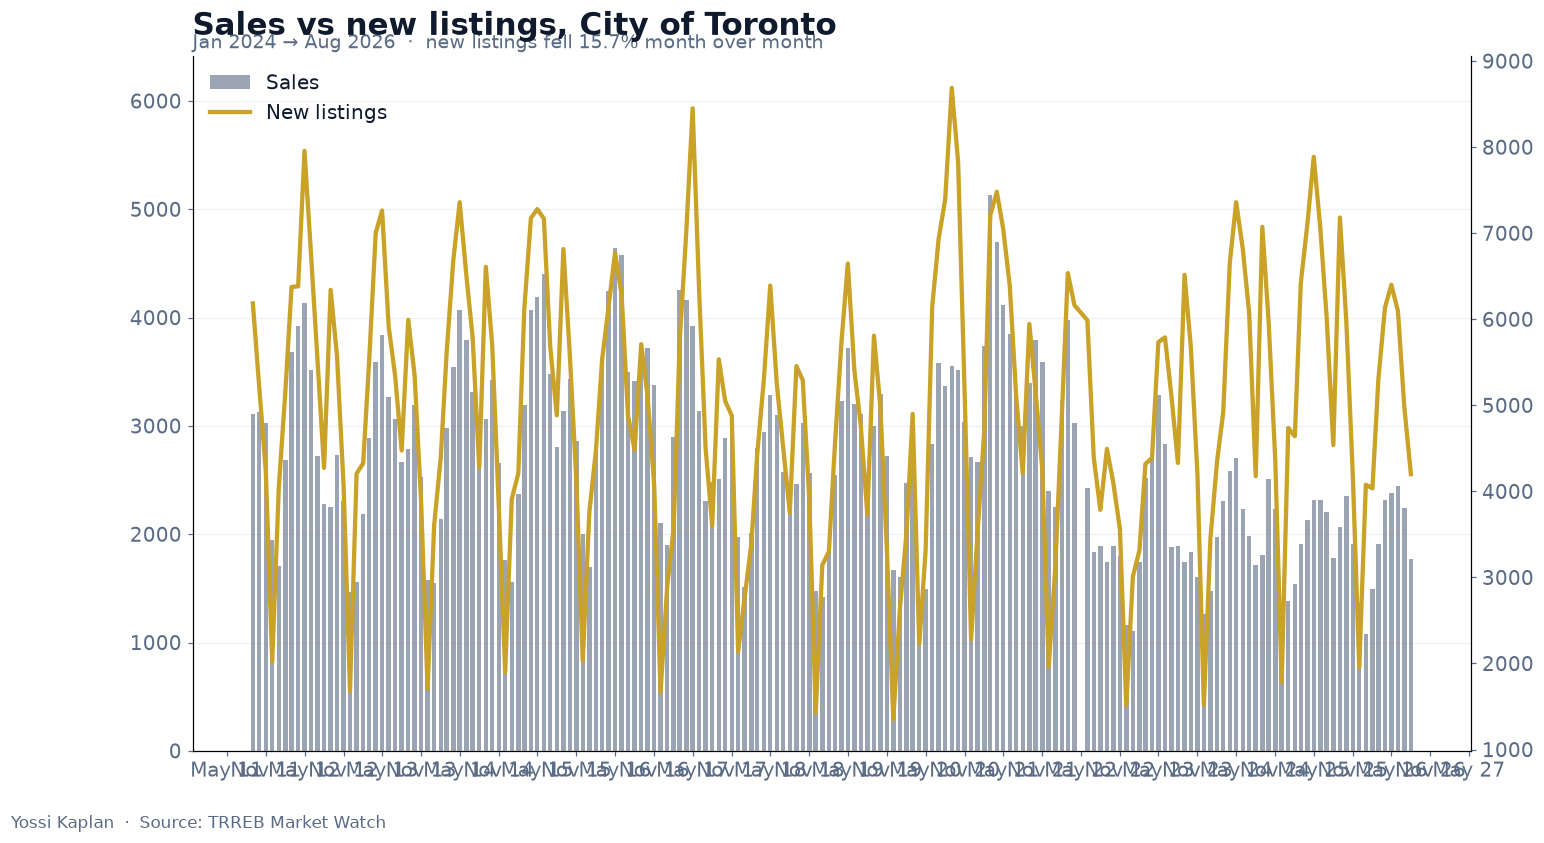
Toronto’s resale market did something quietly important in August: new listings collapsed 15.7% month over month — the sharpest supply pullback of the year — while sales slipped 21% and average prices kept sliding, now 21% below the 2022 peak. Condos are carrying the decline, down 2.4% year over year, while detached homes have gone flat. For sellers, the message is simple: this is a buyer’s market with a supply tap that’s starting to close — the sellers who price it right face less competition with every passing month.
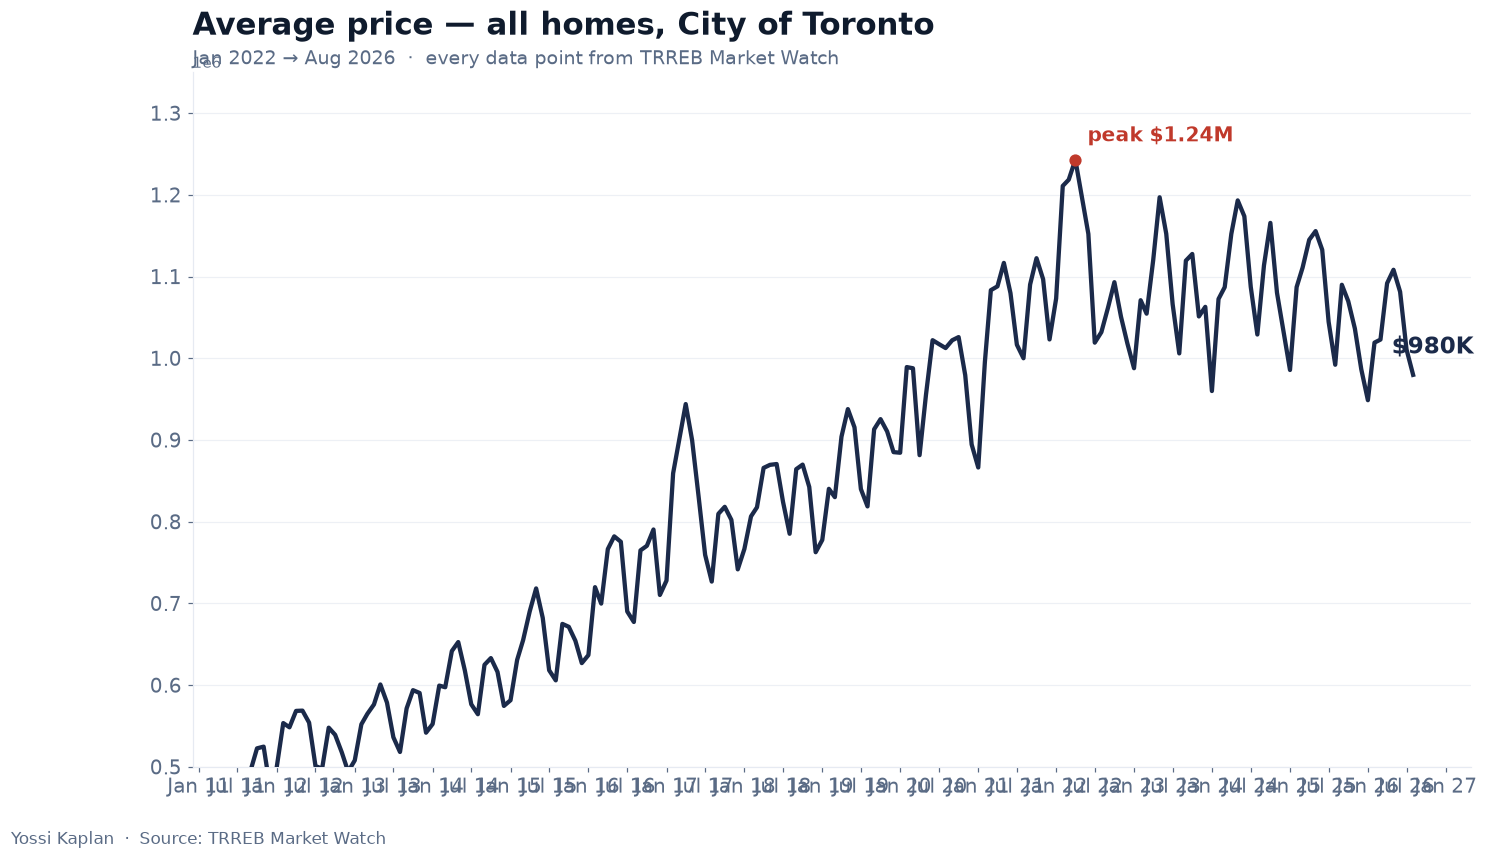
Average prices are 21% below the 2022 peak
The average Toronto home sold for $979,684 in August — down 3.1% from July and roughly $263,000 below the April 2022 peak of $1.24 million. The median tells the same story: $770,000, down 21% from its own peak. This isn’t a crash — it’s a slow, four-year unwind of pandemic-era pricing, and most of the remaining damage is concentrated in the condo segment.
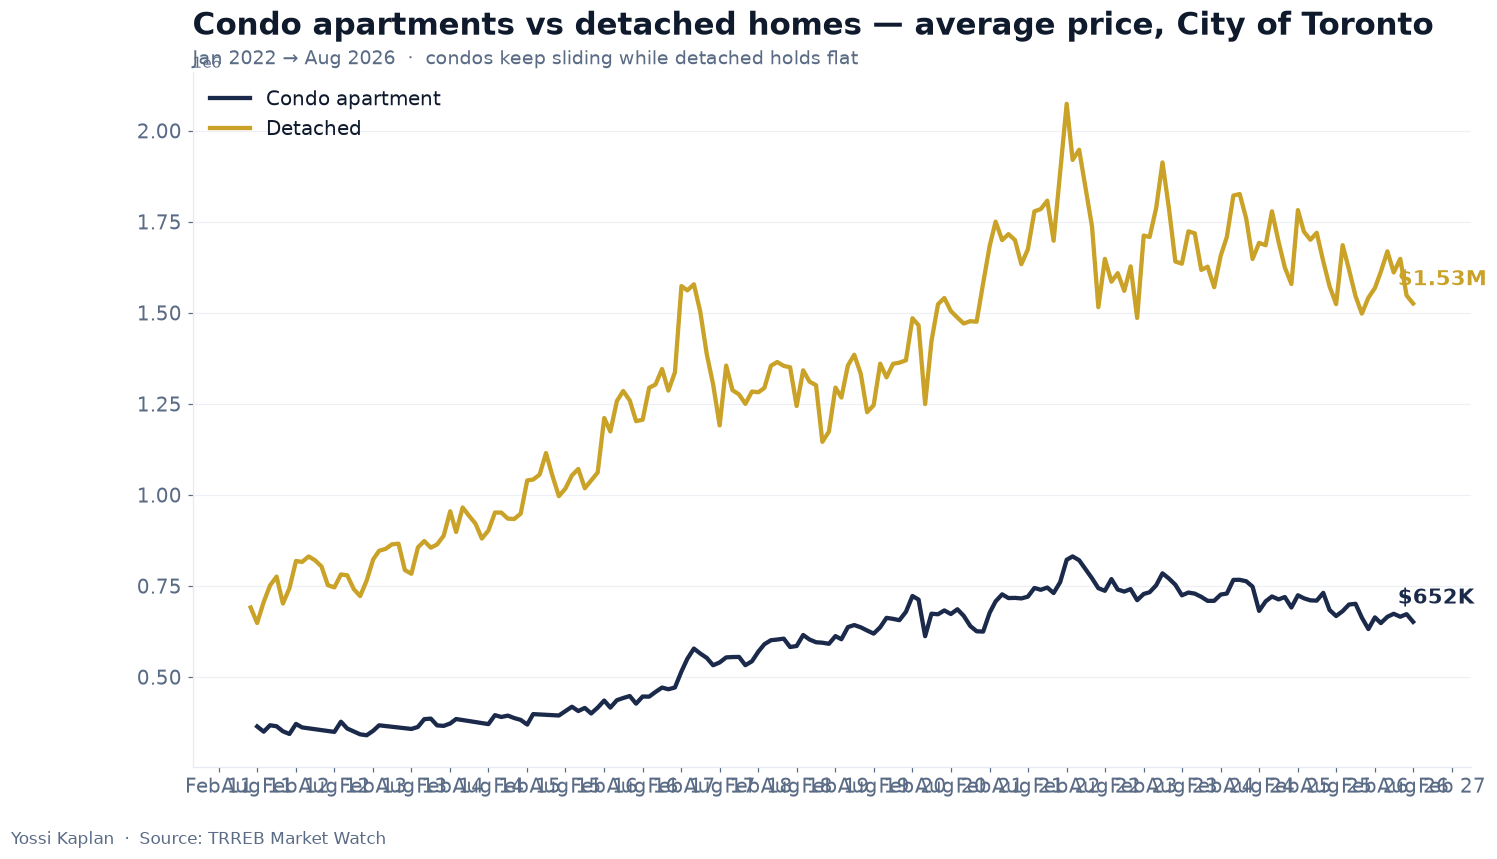
Condo prices are slipping — detached homes are holding flat
Here’s the divergence story: condo apartments averaged $651,648 in August, down 2.4% year over year and 22% below their 2022 peak. Detached homes averaged $1,525,749 — essentially flat year over year (+0.0% to +0.1%), and the only category that hasn’t given back ground over the last 12 months. Condo townhouses are the weakest link, down 9.3% year over year, and their sales volume is thinning fast.
New listings just dropped 15.7% in a month — here’s what that does to prices
Sellers put just 4,200 new listings on the market in August, down 15.7% from July and 7.5% from a year ago. Fewer listings means less competition for the sellers who do list — and it’s the main reason prices aren’t falling faster than they are. Condo supply is pulling back hardest: new condo-apartment listings are down 13.2% year over year, and active condo inventory is down 15.3%.
Toronto is a buyer’s market — and it’s getting deeper
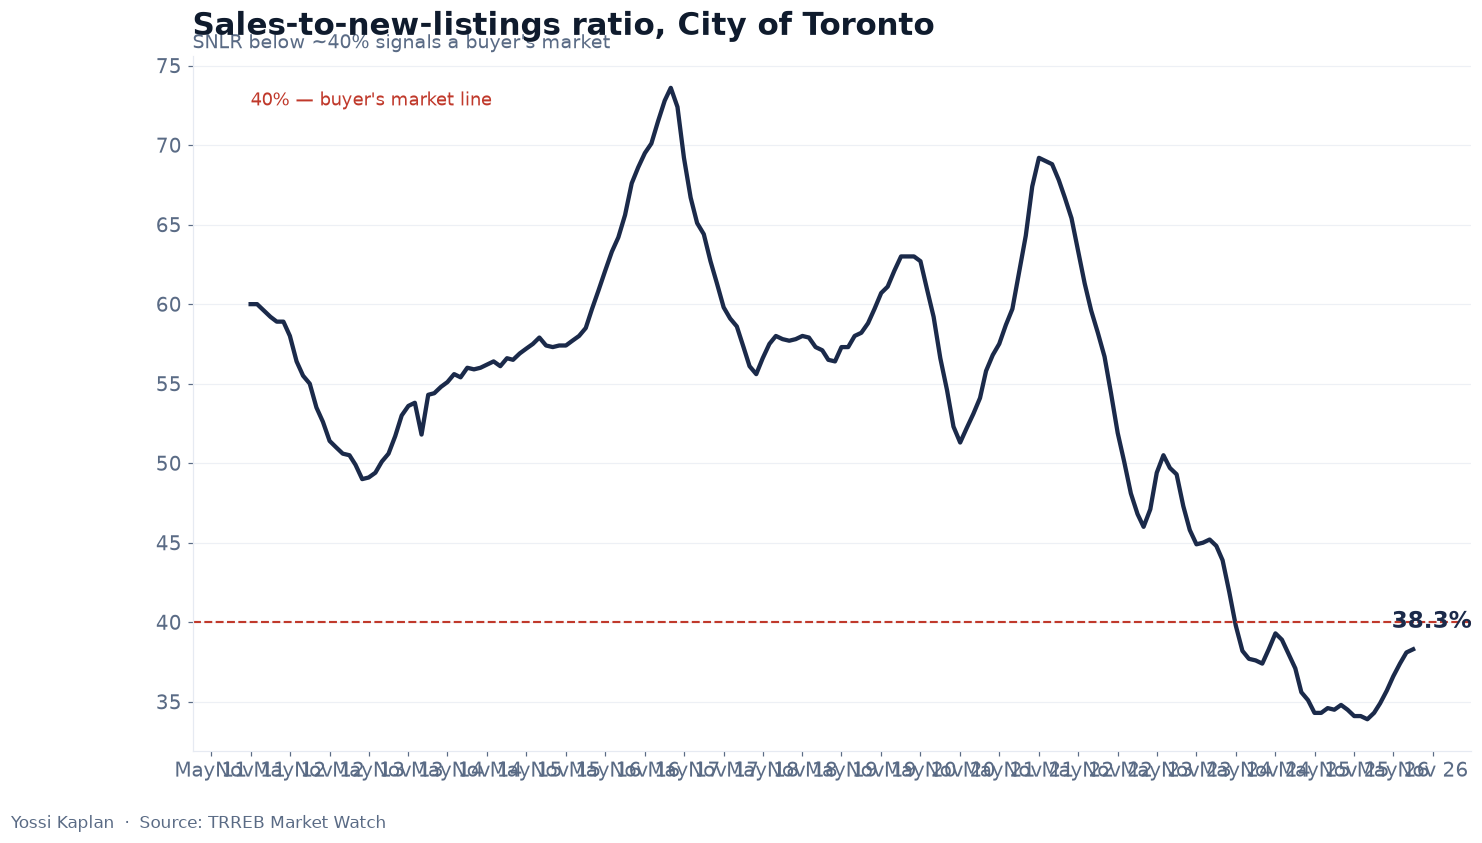
The sales-to-new-listings ratio sits at 38.3% — below the 40% line that separates a balanced market from a buyer’s market, and it’s been under that line for more than a year. There are 4.6 months of inventory on the market, roughly double what a balanced market carries. Buyers have time, choice, and negotiating room; sellers need a strategy, not just a sign.
Homes are taking 35 days to sell — nine days longer than in June
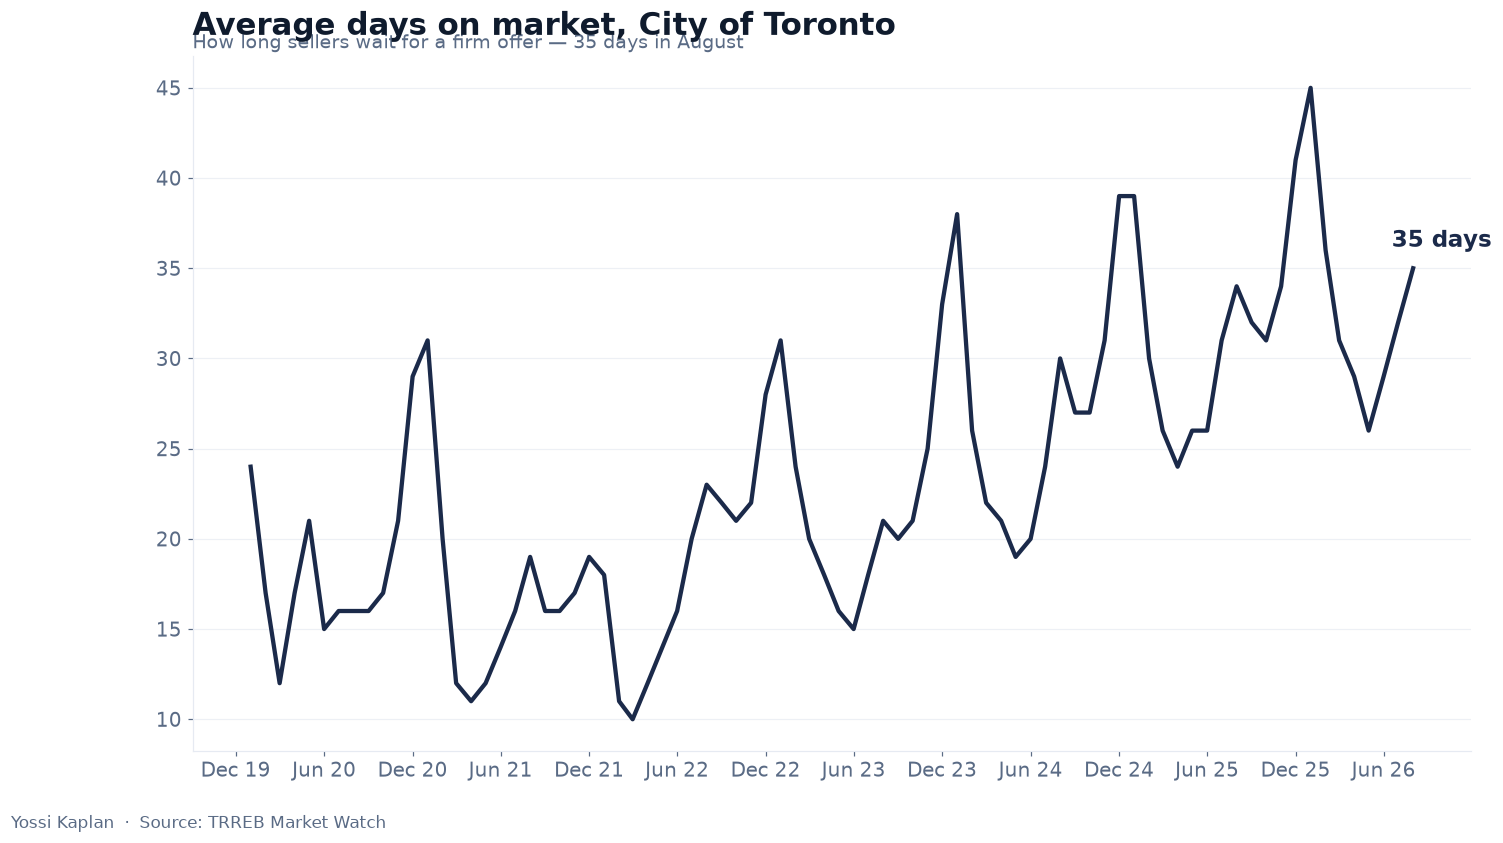
Average days on market hit 35 days in August, up from 32 in July and 34 a year ago — properties now sit about 10% longer month over year. Listings that do sell are fetching 97% of asking price on average. In practical terms: the first 30 days of a listing are everything. Price it right out of the gate, because this market doesn’t forgive second chances.
The category-by-category breakdown
August average prices and sales by home type across the City of Toronto:
| Home type | Avg price | MoM | YoY | Sales | YoY |
|---|---|---|---|---|---|
| Detached | $1,525,749 | ?1.4% | +0.1% | 550 | +2.6% |
| Semi-detached | $1,110,639 | ?1.0% | ?1.8% | 159 | +1.3% |
| Attached / row townhouse | $1,026,018 | ?2.0% | ?9.4% | 45 | ?35.7% |
| Condo townhouse | $712,296 | ?5.9% | ?9.3% | 120 | +3.5% |
| Condo apartment | $651,648 | ?3.1% | ?2.4% | 885 | ?0.6% |
Attached/row townhouse volumes are small (45 sales) — treat that row as indicative, not gospel; the other four categories are solid sample sizes.
What I’d do if I were you — the seller’s playbook for this market
- Price at or just below the current comparable range. In a 38% SNLR market, overpricing costs you the first 30 days — and that’s when the buyers are watching.
- Condo sellers: the slide is real (?2.4% YoY, ?22% from peak). Don’t anchor on what the building listed for in 2024 — anchor on what’s actually selling. Staging and a fresh photo set are worth more per dollar than any price cut you’ll make later.
- Detached sellers: you’re in the strongest segment — flat prices, sales up 2.6% year over year. You can hold firm on price if you’re patient; just budget for 35+ days on market.
- If you can wait: supply is contracting (new listings ?15.7% MoM). Fewer listings in September and October typically firms up pricing power for the sellers who remain. But don’t wait for a spring that may bring 20% more competition.
- Get a professional pricing analysis before you list. Guessing is expensive right now.
Want to know what YOUR home is worth in this market?
A 15-minute conversation beats a month of guessing. Text or call me for a free, no-pressure pricing analysis of your property.